
It’s not Chicken Fried Steak: CFS and Other Streamflow Data Explained

If you are new to paddling in or on a kayak, canoe, or SUP, you have probably been sticking to lakes and easy sections of slow-moving rivers. Once you’ve passed the beginner stage, you’ll probably want to start paddling faster moving creeks and rivers. Maybe you want to start camping overnight on sandbars on some of these waterways. Maybe you are ready to try your hand at some easy to moderate whitewater. In each of these cases, knowing the water level can be a crucial piece of the puzzle when planning a fun, successful, and, most importantly, safe trip. How does one go about finding out this crucial piece of information? The answer is to check out the U.S. Geological Survey’s Waterwatch website.
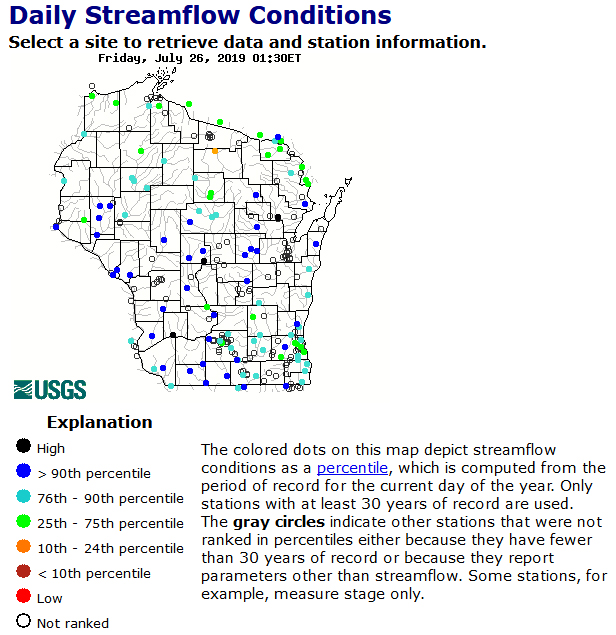
For Wisconsin data, you’ll visit waterdata.usgs.gov/wi/nwis/rt. Once on this page, you’ll see the Wisconsin map with colored dots all over it. These correspond to the current streamflow’s relationship to the historical data. Black means the current levels are above the 90th percentile for that day of the year historically, while red means the current levels are below the 10th percentile for that day. Looking at this map will give you a quick look at the way current water levels compare to the historic levels around the state for that day of the year. 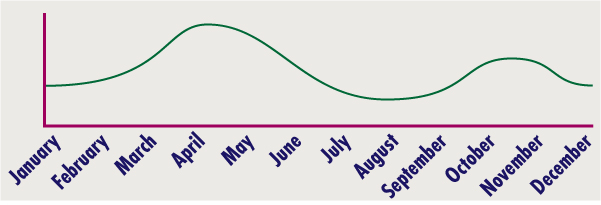 Because average flows vary over the course of the year (resembling the diagram at left) what is black in July could be the same level that is red in April. Therefore, you must dig deeper to understand the data in context.
 Click on the dot corresponding to the river you wish to explore in more detail. That can be tricky on this map, because it requires knowledge of which dot corresponds to which river or creek, and some are very closely packed together. On a phone, this can be even trickier because the site has no mobile-friendly version. Once you are on the page for the waterway you have chosen, you’ll see two important graphs. They might be preceded by the water temperature graph, which is important to anglers and early or late season paddlers.
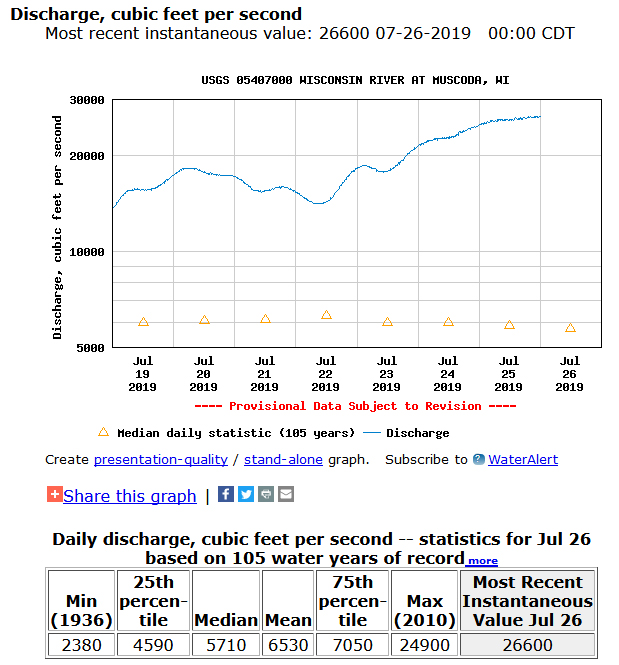 The first important graph depicts the “discharge” data for the past week. The screenshot at left shows the data for the gauge at Muscoda on the lower Wisconsin River as of July 26, 2019. This data is expressed using the mysterious “CFS” measurement that you’ve probably heard your more experienced paddling friends mention. This stands for “Cubic Feet per Second.” It is a measure of how much water is passing by the gauge each second. You’ll note that there are yellow triangles for each day on the graph. Those triangles depict the historical median flow for that day of the year. The triangles are your first useful clue as to how to translate the current CFS into meaningful information. Even if you don’t actually know what CFS corresponds to flows that are too high, too low, or just right, a couple easy conclusions can be drawn based on the time of year. If it is spring snow runoff season and flows are well above the median, it is safe to say that only expert paddlers (and maybe not even them) should be on the water. Similarly, if the CFS is well below the median flow in mid to late summer, it is safe to say that water levels are too low for paddling. At the time of this writing, the gauge is reading 26,600cfs, which is about 6,600cfs above the most flow I would ever consider paddling. At the current level, the water is flowing fast with lots of unpredictable swirls, and nearly all sandbars are covered. This makes for a boring, short, and slightly dangerous trip. Note that the flows have varied widely over the past week.
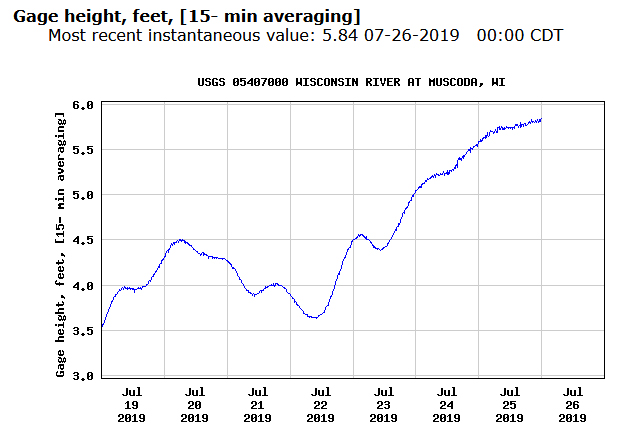 The second important graph depicts the “gauge height” in feet. This usually corresponds to how deep the water actually is where the gauge is located. I write usually, because there are a few gauges across the state that clearly do not correspond to actual water levels. The Ontario gauge on the Kickapoo is one example. It might read 10 feet normally, but the water where that gauge is located is rarely over three feet deep. The screenshot at right depicts the graph for the same lower Wisconsin River gauge at Muscoda in the week leading up to July 26, 2019. Note one important difference between this graph and the discharge graph. The discharge graph shows a logarithmic scale while the gauge height graph is a linear scale. Both graphs have a similar shape to the flow data. Because a typical streambed gets wider the higher you go, each additional inch of water represents a disproportionally larger amount of water passing the gauge. One thing to note about this graph is that it will typically show the National Weather Service action and flood stages for this gauge. If current levels are above the green line (action stage), it is rare that conditions are safe for paddling. If they are close to or above the red line (flood stage), definitely stay off the water.
There are waterways where I use the CFS reading and others where I primarily look at the gauge height. It all depends on my experience and which metric makes more sense. For example, I always use the CFS reading when looking at the Muscoda gauge pictured above. On the other hand, when planning to paddle the Kickapoo, I use the the gauge height graph for the LaFarge gauge.
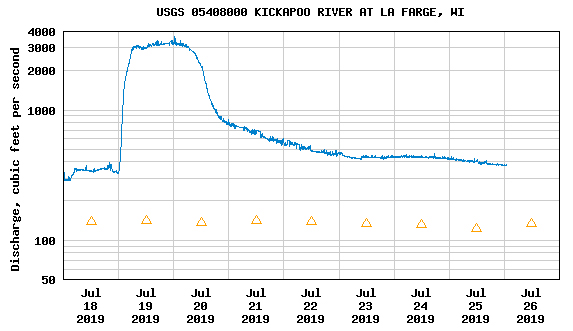 The LaFarge gauge helps demonstrate another important phenomenon. You may have noticed the smooth graphs from the Muscoda gauge shown above. The reason those are so smooth and gradually rising and falling is because the gauge is about 44 miles downstream from the Prairie du Sac dam. Between the dam and the gauge, there is one major river and numerous major and minor creeks that add water to the Wisconsin River. This makes for a fairly smooth transition. The two screenshots at right show the two graphs for the week leading up to July 26, 2019 for the Kickapoo River at LaFarge. The Kickapoo watershed is notoriously “flashy,” which means it rises very quickly during and after a major rain event. That happened where you see these graphs rise sharply over the course of less than a day. The water levels went from just over 4 feet to just over 12 feet.
 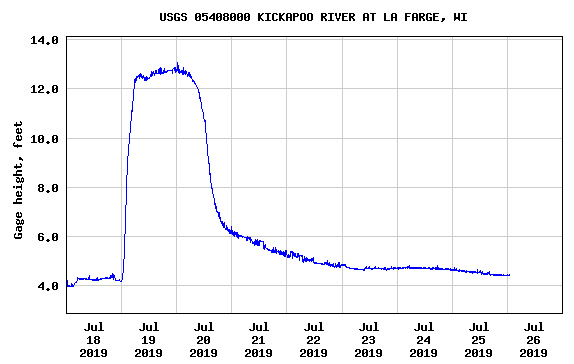 The river also comes down very fast, but not as quickly as it rose. As a frame of reference, I personally won’t paddle the river when that gauge is above 5 feet, and I wouldn’t recommend anyone do it above 6 feet. Too fast, too dangerous, and not that fun. Note that the highest level this past week was just below 4000cfs. That would be suicide to paddle at that level. However, 4000cfs would only be inches deep on the lower Wisconsin. The width of the streambed makes a huge difference in what the CFS readings mean in practice.
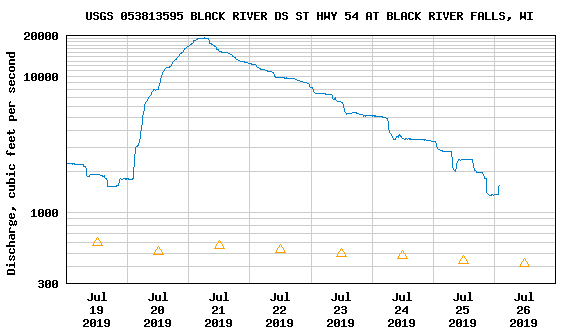 Despite how fast the levels rose and fell on the Kickapoo, the graphs were also fairly smooth. Take a look at the screenshot at left which depicts the graph for the past week on the Black River. Notice how choppy and angular the graph appears? This gauge is only about 500 feet downstream from the dam at Black River Falls. When gates on the dam are opened or closed, the levels recorded at this gauge rise and fall very quickly, leading to the choppy graph. Safe paddling levels for the lower Black, in case you wondered, are 2000cfs and below.
Now that I’ve thrown a lot of terminology, geometry, and math at you, you might be wondering how you can use the CFS and gauge heights to inform your choice of rivers to avoid or paddle. Beyond experience with different levels, there are some resources to help you out. The two main conclusions you are looking to reach for any stream you plan to paddle are whether the levels are too low (which means you might have to get out and drag your boat often) or too high (dangerous, too fast, no sandbars to camp or hang out on). There are four main online resources from which you can glean this information.
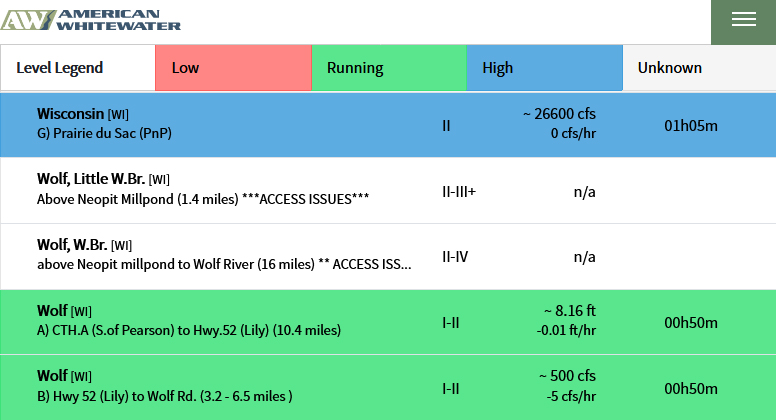 The first is the American Whitewater page for Wisconsin. This has a listing of most of the rivers people commonly paddle in the state. Because the focus is on whitewater, river sections that have no whitewater at all won’t typically be included here. However, since there is a quick whitewater run just below the Prairie du Sac dam, the Muscoda gauge on the lower Wisconsin is included here. In the screenshot shown at right, the page currently shows the level at the Muscoda gauge as the same 26,600cfs you saw in the USGS graphs. The streams are color coded red (too low), green, and blue. Currently the lower Wisconsin is blue, which means too high for safe paddling. This will also show the rate of change in the levels. If you click on each river, you’ll get additional descriptions and photos of the rapids.
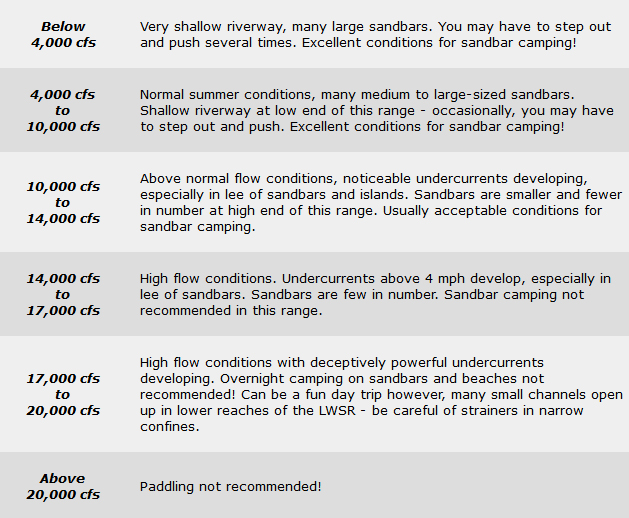 The next resource is the Wisconsin Trail Guide website. This site has descriptions of each section of the major rivers in Wisconsin as well as PDF guides and maps you can download and save to your device or print and laminate. If there is a gauge on the river (not all rivers have a USGS gauge), the bottom of the page for that river will have a description of what each CFS level means for paddling. At right is a screenshot of that description for the lower Wisconsin River. You will see that most of the descriptions match with assertions made in this article. These guides are a helpful way to translate that information.
Because both of the previous resources have gaps or limitations, the next important resource is Miles Paddled. The guys at Miles Paddled have reports on most navigable creeks and rivers around Wisconsin as well as some lakes, flowages, and marshes. They also have some reports on waterways in Illinois, Iowa, and Minnesota. They always mention what CFS/height data was available for the day they paddled. Sometimes there is no gauge on that section of water, so they always provide reference USGS gauges for nearby rivers or visual gauges. An example of a visual gauge would be in the report I submitted to the site for the Flambeau River. There is no gauge, but there is a big boulder right next to the put-in. Whether it is visible or covered gives paddlers a good sense of how high the water is. In addition to providing the actual data, they always give advice on whether that level was too high, too low, or just right.
There is one additional resource, and that is to check out the Facebook pages of paddling clubs and Meetup groups. When I post photos from trips with my two main groups, Mad City Paddlers and the Madison Area Outdoor Group, I also include the relevant CFS and/or gauge height information for the waterway on that day. In the description, I always mention what I thought about that water level.
Thanks for reading, and I hope this didn’t make your head explode. Hopefully the resources I shared will help you have fun and safe trips on Wisconsin waterways!